The Situation
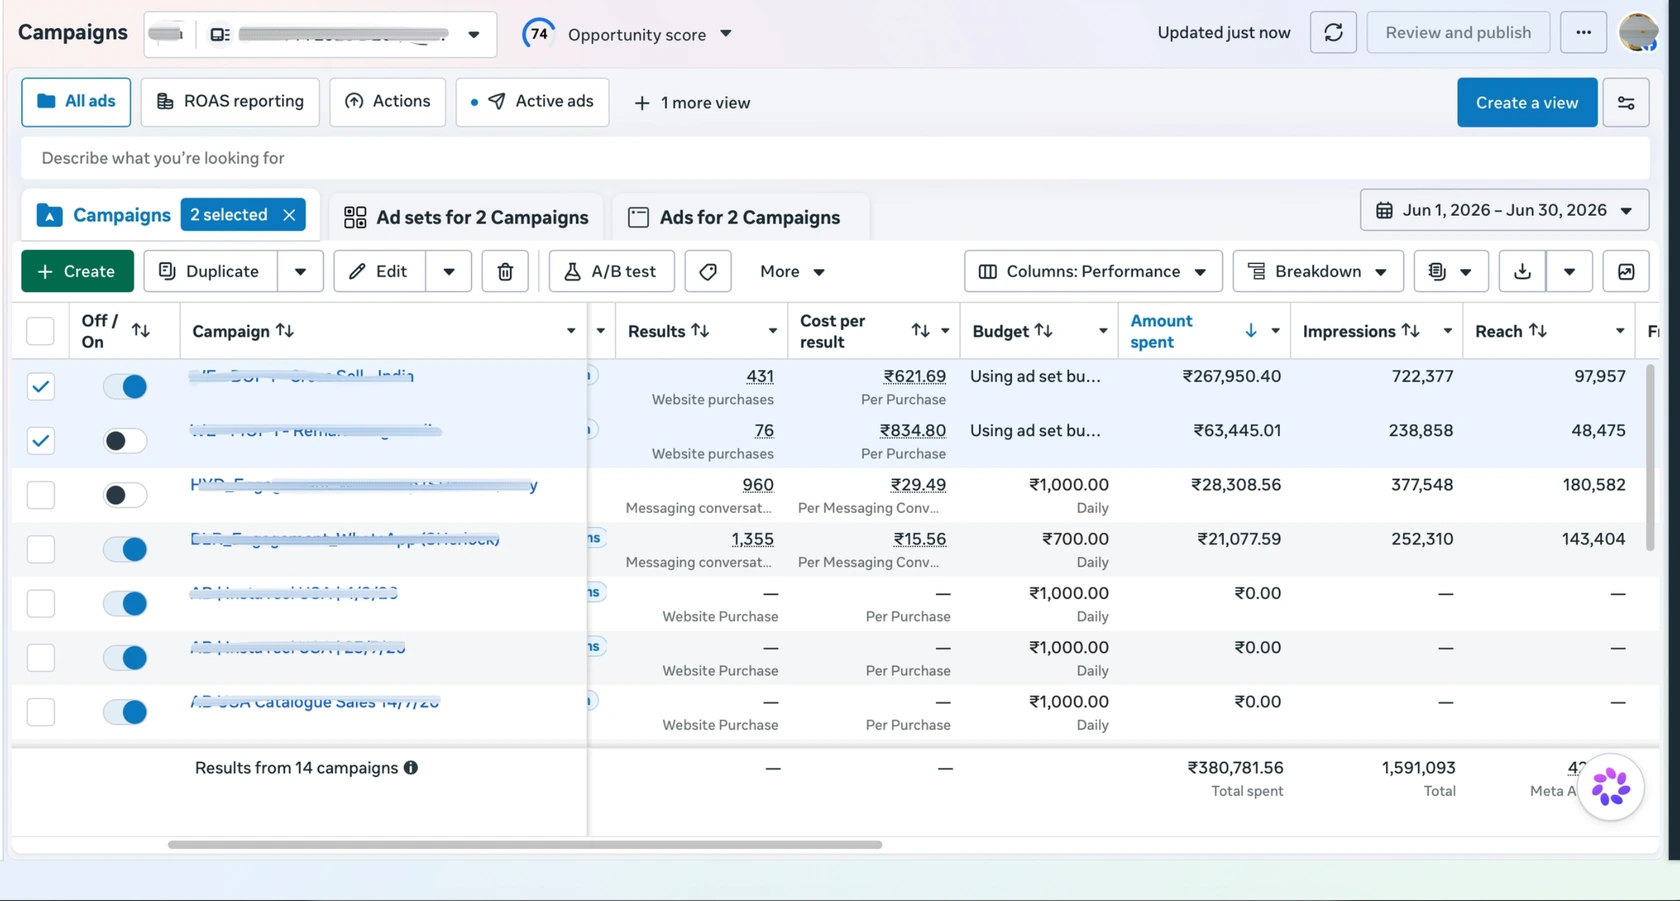
This client is a premium menswear e-commerce brand based in Pune, shipping worldwide, with an average order value of ₹3,500 to ₹4,000. Their Meta Ads ROAS was capped at 1.5X, and nothing they tried on their own, adjusting budgets, swapping creatives, tweaking audiences, moved it. Performance stayed locked in a narrow 1X to 1.5X band regardless of what changed.
At that ceiling, every rupee spent on ads was barely breaking even. Scaling spend wasn't an option until the underlying account was fixed, so the brief was direct: diagnose why performance was stuck, and rebuild the account into one that could grow profitably.
What We Did
Rather than optimizing what was already running, we treated this as a ground-up rebuild across two fronts at once: audience and creative. Both were tested directly inside the account, ad set by ad set and ad by ad, so we could see what was driving purchases within weeks, not months.
Audience testing: 6 ad sets
We ran 6 ad sets across the two campaigns rather than one broad audience. Here's exactly how each performed, pulled directly from Ads Manager:
| Ad Set | Purchases | Cost / Purchase | Spend | Impressions | Reach |
|---|---|---|---|---|---|
| Ad Set 1 | 225 | ₹528.46 | ₹118,904.12 | 450,000 | 80,034 |
| Ad Set 2 | 206 | ₹723.53 | ₹149,046.28 | 272,377 | 45,860 |
| Ad Set 3 | 24 | ₹782.53 | ₹18,780.83 | 93,074 | 19,467 |
| Ad Set 4 | 24 | ₹775.23 | ₹18,605.56 | 42,694 | 13,030 |
| Ad Set 5 | 12 | ₹1,087.36 | ₹13,048.30 | 79,466 | 29,913 |
| Ad Set 6 | 16 | ₹813.15 | ₹13,010.32 | 23,624 | 8,704 |
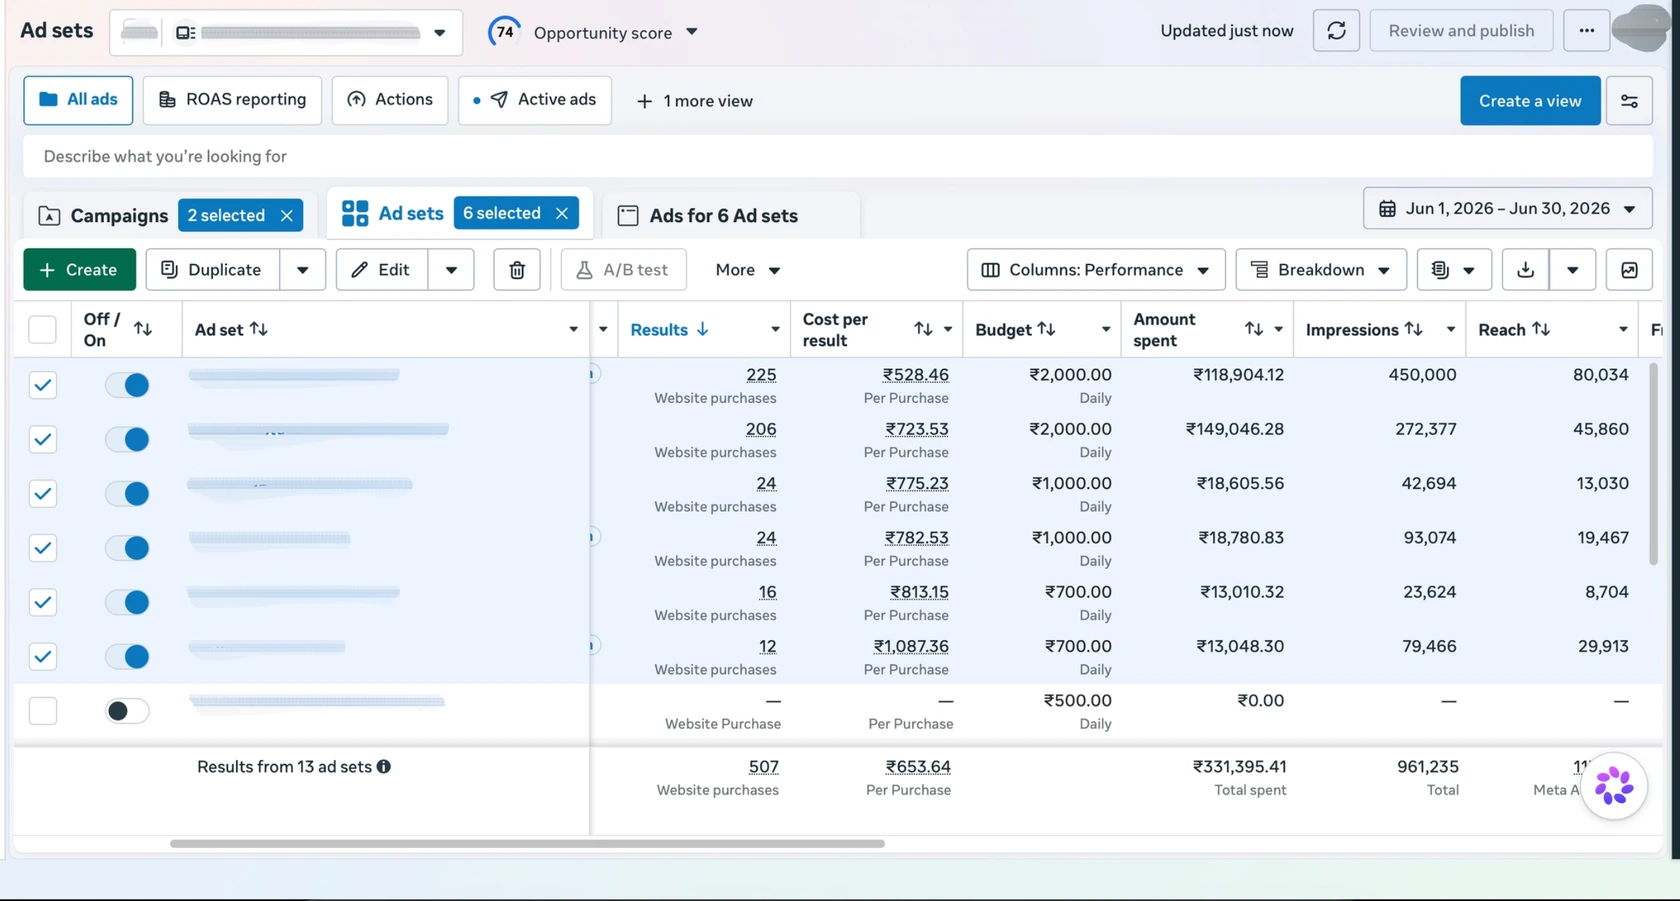
Ad Set 1 and Ad Set 2 alone accounted for 431 of the 507 total purchases, roughly 85% of everything the account drove that month, on 81% of total spend. The remaining four ad sets, on 19% of spend, produced the other 15% of purchases at a noticeably higher cost per purchase each.
Creative testing: 14 ads in market
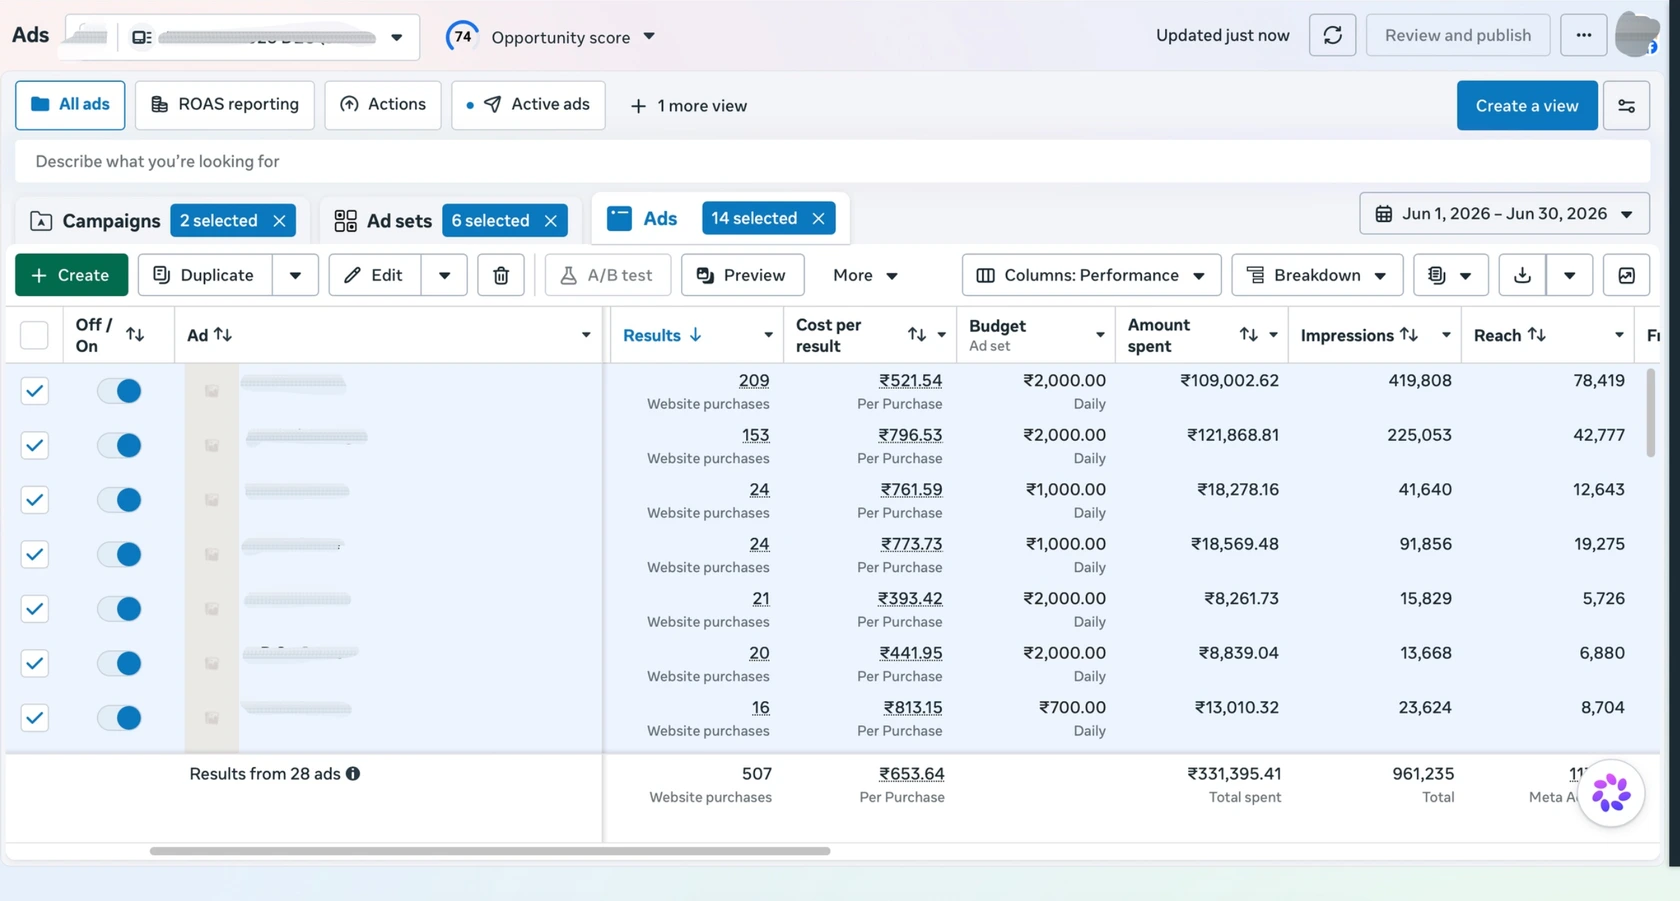
In parallel, we ran 14 live ad variations across these 6 ad sets rather than a single hero creative per ad set, and let performance decide which ones earned budget.
The Results (June 2026, 1-Month Snapshot)
| Metric | Campaign 1: Cross-Sell | Campaign 2: Remarketing | Combined |
|---|---|---|---|
| Website Purchases | 431 | 76 | 507 |
| Cost per Purchase | ₹621.69 | ₹834.80 | ₹653.64 (blended) |
| Amount Spent | ₹267,950.40 | ₹63,445.01 | ₹331,395.41 |
| Impressions | 722,377 | 238,858 | 961,235 |
| Reach | 97,957 | 48,475 | ~146,432 |
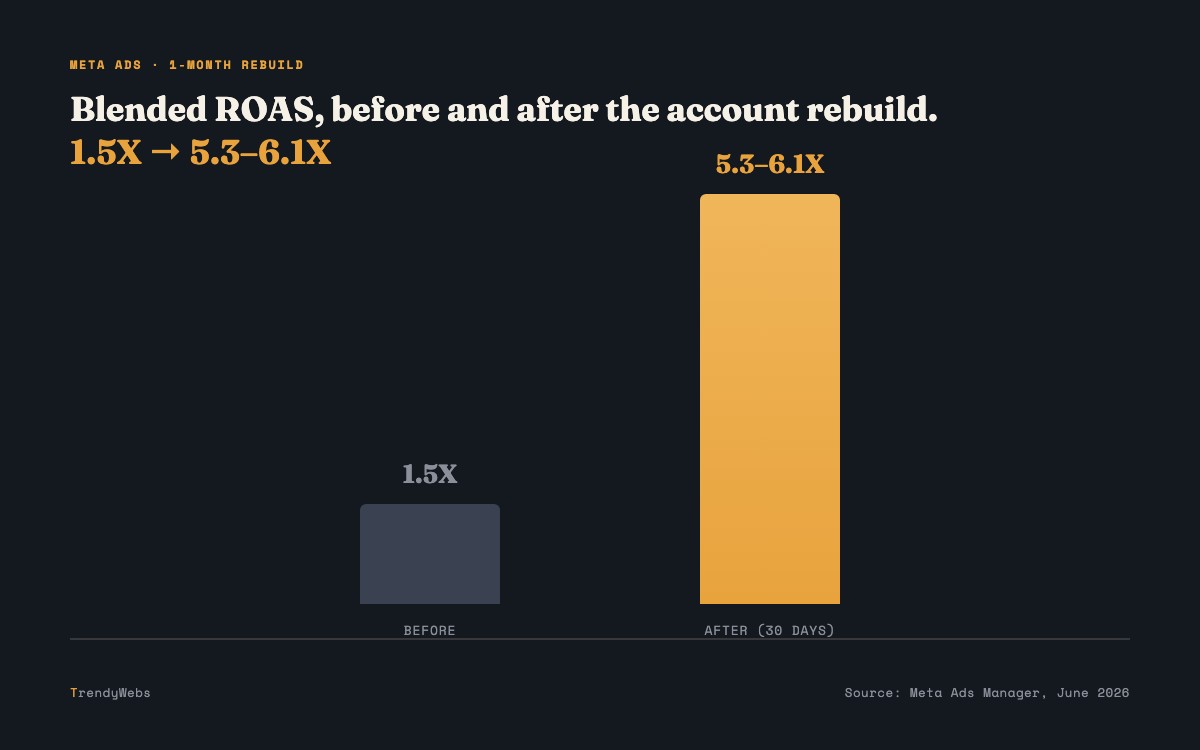
At an AOV of ₹3,500 to ₹4,000, those 507 purchases translate to an estimated ₹17.75L to ₹20.3L in attributed revenue from ₹3.31L in spend. That puts blended ROAS at approximately 5.3X to 6.1X, nearly 4X the client's previous ceiling of 1.5X, reached within the first month of the rebuild, without any increase in monthly ad spend.
What Moved the Needle
Two of the six ad sets did almost all of the work. Ad Set 1 and Ad Set 2 combined for 431 of the 507 total purchases, 85% of the month's volume, on 81% of total spend (₹267,950.40 of ₹331,395.41). The other four ad sets, working with the remaining 19% of budget, produced the last 15% of purchases at a visibly higher cost each.
Cost per purchase varied more than 2X across the six ad sets. The cheapest, Ad Set 1, converted at ₹528.46 per purchase. The most expensive, Ad Set 5, cost ₹1,087.36, more than double, for roughly a tenth of the volume (12 purchases against 225). That spread is the practical case for running several ad sets at once instead of one broad campaign.
The spread held at the individual ad level too. Among the ads with visible reporting in the screenshot above, cost per purchase ranged from ₹393.42 to ₹813.15, more than a 2X difference between the cheapest and most expensive ad in market that month. Which ad wins isn't obvious ahead of time, which is the argument for testing several rather than committing budget to one.
Most of the account wasn't running at all, and that's by design. Of 14 campaigns in this ad account, 2 are part of this engagement. Of 13 ad sets inside those 2 campaigns, 6 spent anything. Of 28 ad variations built, 14 delivered impressions in this window. The screenshots throughout this page show the full account view, inactive rows included, not a curated selection of the good numbers.
Further reading: Blended ROAS vs New-Customer ROAS and Ad Metrics That Actually Matter, on why we report ROAS the way we do.
Why This Matters
A brand stuck at 1X to 1.5X ROAS is not failing because Meta Ads doesn't work for premium apparel. More often the account has simply never been tested with more than one or two ad sets and ads carrying the whole load. The numbers on this page aren't a summary or a rounded-up estimate, they're what Ads Manager reports for this account in June 2026, screenshots included, so every claim here can be checked against the source.
Client name withheld at their request. Metrics sourced directly from Meta Ads Manager reporting, June 2026.
FAQ
Two ad sets are responsible for the majority of this result. Whether that holds into month two depends on whether their audience pool has room to keep scaling, or whether performance tapers as that pool saturates, that's the open question a single month of data can't answer on its own.
Purchases and spend are pulled directly from Meta Ads Manager. Revenue and ROAS are estimated using the brand's known AOV range of ₹3,500 to ₹4,000 per order, since exact per-order revenue wasn't isolated in this reporting window. That's why we report a range rather than a single decimal.
Because those are the only ones that spent money and delivered impressions in this window. The other 7 ad sets and 14 ads were built but never had budget flow to them, they show up in Ads Manager as blank rows, exactly as they appear in the screenshots on this page.
The brand had already tested budgets, creatives, and audiences on their own, one change at a time. This rebuild ran 6 ad sets and 14 ads at once inside a single month, the full spread is in the screenshots above, rather than testing one variable, waiting weeks, then testing the next.